Welcome to SEWERIN ![]() Info Centre
Info Centre ![]() Publications
Publications
Leak detection in water distribution networks by correlation
Sound velocity as a possible source of error
Sound velocity as a possible source of error
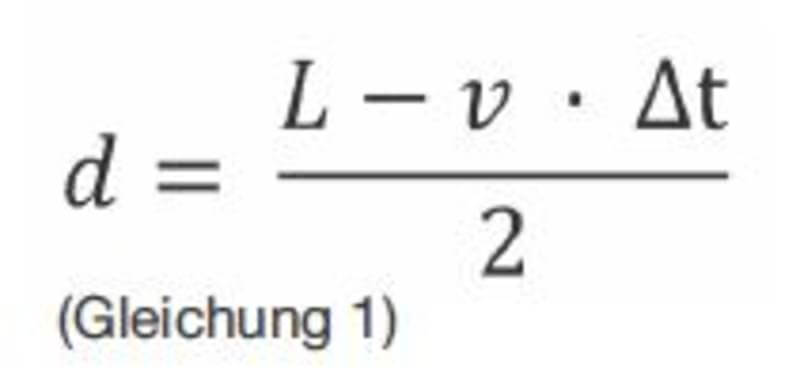
The use of correlators in water leak detection has long been standard practice when pinpointing leaks. The noise emitted by a leak is recorded simultaneously by two microphones and the run time difference (Δt) is calculated. The user has virtually no influence on the result of this calculation. In addition to Δt, the length of the pipeline (L) and the sound velocity (v) are also important in determining the distance of the leak from the two measuring points. Figure 1 shows the relationship between the relevant variables.
If the value of Δt is known, then the distance of the leak from the first measuring point is as follows:
In practice, the length of the pipeline can usually be measured with sufficient accuracy using a measuring wheel. In all modern correlators, the sound velocity with which the noise emitted by the leak is propagated in a pipe is stored in tables. The user selects a value from this table for the calculation according to the nominal pipeline size and the material from which it is made. There is no simple way of checking the table value for use with an actual leak. If a measuring error occurs in a correlation, the influence of the sound velocity is often underestimated or not even considered as a possible cause – a good reason for taking a closer look at the true influence of sound velocity on the result of a correlation measurement.
We began by comparing the sound velocity tables for a number of well-established correlators. As the use of plastic piping in the water supply network has increased steadily over the years, we focused on two commonly used materials: PE and PVC. The values from the sound velocity tables were plotted as a graph (Figures 2 and 3).
Figures 2 and 3 show that the sound velocities for the same nominal diameter and the same material vary from one manufacturer to another – sometimes quite significantly. Even for the same manufacturer the values in two tables may differ. For example, the stated sound velocity for a DN100 PE pipe varies between approximately 260 m/s and 380 m/s. For a PVC pipe of the same nominal size, values range from about 415 m/s to 450 m/s. Manufacturers often describe the values in their tables as "empirical values", with no further details of their origin.
The next step was to consider how the sound velocity in pipes can be calculated mathematically. Equation (2) is based on the publication "Einführung in die Korrelations-Messtechnik"; in: ELEKTRONIK, No. 2, 1971 by P. SCHÖLTZEL:
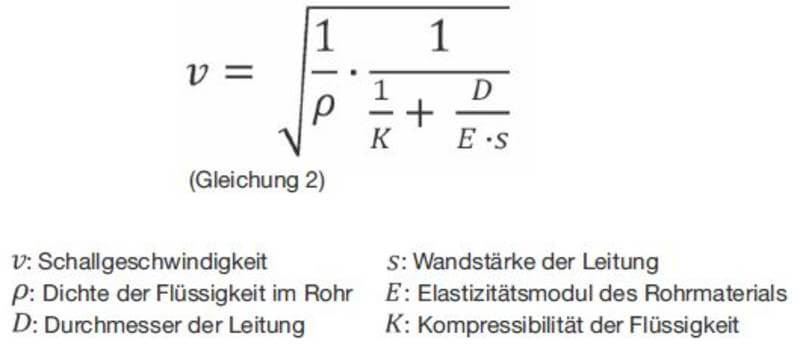
From equation (2) we can see that it is primarily the diameter, the wall thickness and the modulus of elasticity that influence the sound velocity. The density and compressibility of the liquid in drinking water pipelines are assumed to be constant under operating conditions and are not dependent on the pipe. Limiting the consideration to material and diameter, which are stored in the correlator tables, does not appear to be adequate. A more accurate specification of the pipe material is needed. The dependence of the sound velocity on D/s suggests that the SDR class of the pipe should be taken into account in the calculation, and hence the nominal pressure stage of the pipe.


The sound velocities were calculated for commonly used PVCu pipes in the nominal pressure stages PN 6, PN 10 and PN 16 with the corresponding wall thicknesses and moduli of elasticity. The material-specific parameters were found on the internet in the manufacturers' technical data sheets.
Calculating the sound velocities for PE pipes was more complicated, since pipe networks now include a variety of PE pipes. The most important of these in practice are pipes made from PE80, PE100 and increasingly also PE-X. The moduli of elasticity of these three materials differ substantially. Simply dividing them into "soft" and "hard" is not sufficient in practice. In addition, PE pipes are also used in various nominal pressure stages – and hence various SDR classes.
The sound velocities for pipes made from PVCu and various PE materials are shown in the graph in Figure 4.
Figure 4 shows that the calculated sound velocities are independent of the pipe diameter. Regardless of the nominal size, the ratio of diameter to wall thickness within an SDR class remains constant, and therefore so too does sound velocity as a function of diameter. This finding contradicts the tables provided for each correlator.
For PE80 or PE100 pipes, the sound velocities within a nominal pressure stage are very similar. The sound velocity in PEX pipes is around 3 times higher.
By contrast, in PVC pipes the nominal pressure stage is largely responsible for the sound velocity. The variation between the individual pressure stages, at around ±25%, is very marked.
The significant differences between the sound velocity values in the tables and those obtained by calculation prompted us to conduct series of measurements in water pipe networks under realistic conditions. The aim of the measurements was to obtain reliable evidence of whether it is sufficient to rely on the table values when using a correlator, or whether calculated values offer a more accurate picture of conditions within the pipeline.
To this end we began a six-week series of tests with the kind support of one of the network operators. Over this time the sound velocity was measured on 242 measuring sections in a water supply network using artificial leaks. The pipeline lengths varied between approximately 3 m and 104 m.
Figure 5 provides an overview of the materials found in the pipe network and the number of measurements carried out for each material/diameter combination. The analyses were subsequently restricted to PVCu DN100 and PE80 d110, because sufficient numbers of measurements for statistical analysis were only obtained for these material/diameter combinations (Figure 6).
In a series of preliminary tests it was found that neither the location of the open hydrant in relation to the measuring section nor the amount of water discharged had an influence on the measuring result. Nor did the age of the pipe sections have any influence on the measuring results.


The actual sound velocity measurements were carried out as follows: For each measurement an artificial leak was created by opening a hydrant outside the measuring section; the escaping water was discharged in a systematic manner. Only accelerometers were used. Hydrophones were not applied because of the anticipated influence of the network pressure. All measurements were taken on uniform pipe sections of a known material. Sections with varying materials and/or diameters were not tested. The measurements were filtered during analysis to produce a clear correlation result. The filters were set so that only clearly coherent signals were processed. Interference noise, as can be seen in Figure 7 to the right and left of the selected region, was not used for the correlation, as it dramatically increases the ambiguity of the correlation peak.
The results were divided into different sound velocity classes. The width of each class was 50 m/s. The results can be seen in Figures 8 and 9.
The sound velocities for PE80 d110 are between 207 m/s and 582 m/s. The very low and the very high sound velocities between them represent only about 3% of all measurements, suggesting a measuring error. With an 81% probability the measured sound velocity was between 401 m/s and 500 m/s.
Similar results were found for PVCu DN100. Once again the sound velocities were between 401 m/s and 500 m/s with an 81% probability.
Comparing the measured sound velocities with the table values from all manufacturers included in the analysis and with the calculated theoretical sound velocities shows that there does not appear to be a universally applicable sound velocity for each material and diameter, and that neither the theoretical calculation nor the table values accurately represent the actual conditions in the pipe network. In addition, the assumption that PE pipes propagate noise more slowly than PVC pipes could not be proved.
The length of the pipeline is often thought to be a possible influencing factor on the sound velocity. Therefore the measuring results were also plotted against the length of the measuring section (Figures 10 and 11).
Figures 10 and 11 show that in PE80 pipelines the scattering of the results was higher on very short measuring sections (< 10 m) than on longer measuring sections. In PVCu pipes this effect was apparent up to a section length of approximately 35 m. However, there was no direct correlation between length of measuring section and noise propagation velocity. Therefore the sound velocity can vary with the same probability on short or long sections.
Another assumption is that the measured sound velocity is directly dependent on the frequency of the leak noise. Since all the correlation results were filtered to reduce the ambiguity of the peak, the average, filtered frequency was calculated for each measurement. Figures 12 and 13 show the sound velocities plotted against the average filter frequencies.
Figure 12 shows that – in line with expectations – the majority of the noise in the low frequency range was coherent and therefore particularly suitable for correlation. At the same time, much of the noise showed a clear coherence in the range between 500 Hz and around 700 Hz. However, the range at which the filter was set had no discernible influence on the sound velocity measurement. The measured values were in the same sound velocity range for both low and high filter frequencies.
In the case of measurements on PVCu pipelines, the clear majority of the noise was in the frequency range below 300 Hz. The few higher-frequency measurements also produced sound velocities in the same range (Figure 13).
Therefore no direct correlation between sound velocity and leak frequency could be proved.
To summarise, we can conclude that the sound velocity in a pipe does not have a fixed value which can be taken from a table or calculated. Instead, the actual sound velocity appears in practice to depend on many factors which the user cannot be aware of. No dependence on pipeline length or the chosen filters could be proved.
So what is the significance of these findings for the practical use of correlators in the pipe network?
In order to answer this question, we have to consider the potential sources of error.
It is clear from equation (1) that an error in determining the length is halved in the result. That is not the case with the sound velocity. A possible inaccuracy always shows up in the result as the product of v ∙ Δt. What that means in practice can be seen from the following example calculation:
Let us assume that a correlator on a PVCu DN100 pipeline of length 100 m has calculated a time delay of 160 ms. The sound velocity in this pipeline is very probably between 350 m/s and 500 m/s (see Figure 9). Using the critical velocities in equation (1) gives us the following:
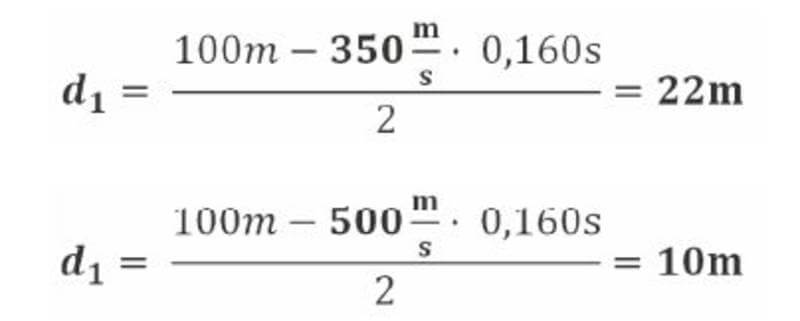
The calculated position of the leak for the two critical velocities differs by 12 m. In practice, however, correlation should deliver a very accurate location and not a supposed length range of 12 m. In this first example the correlation result corresponding to the position of the leak is well outside the middle of the measuring section (Δt is large). If two measuring points can be chosen such that the leak is in the middle, and therefore Δt becomes small, the divergence in the position calculation should be smaller.
In the second example one of the measuring points is moved to give a new length of 25 m. The correlator now calculates a Δt of 5 ms, for example. The position calculation then looks like this:
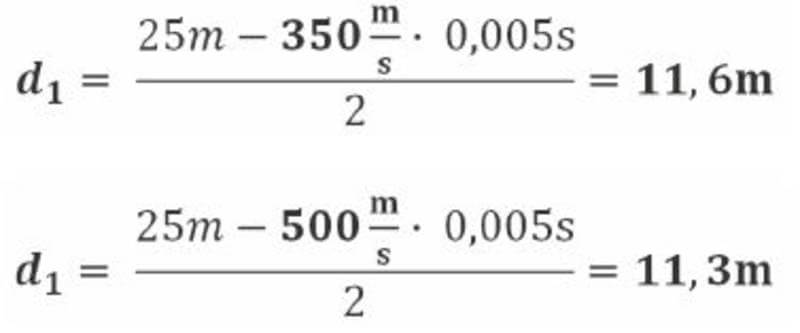
The difference between the results is now just 0.3 m, even though in this case too the actual sound velocity is probably between 350 m/s and 500 m/s.
The two example calculations show that precise pinpointing is possible, almost regardless of the sound velocity, provided that in practice the measuring section can be set up so that the calculated leak position is very close to the middle of the measuring section.
However, there are also measuring sections which do not allow the measuring points to be moved because there are only a few connection points on the pipeline or it is an end section, for example. In such a case one option is to measure the actual sound velocity. In addition to the existing noise this requires another source of noise at a known position. This should ideally be outside the actual measuring section. What is important is that the correlator is able to measure a second peak corresponding to the "artificial leak". In order for this to be possible, it is usually necessary to be able to vary the noise intensity of the additional source of noise; hydrants or regulatable main valves are ideal for this.
In addition, many correlators also offer the option of a multi-point measurement. Some use three or more real measuring points, while others systematically move one measuring point, in which case they do not need additional radio transmitters. Provided that the source of noise is always within the measuring section, the leak position is calculated independently of the sound velocity. The mathematical methods were published back in the 1980s and implemented in correlation measurement technology, although they are largely disregarded today. Yet these methods are very easy to use, require no additional sources of noise and make use of the movement of measuring points, which is often used in any case in practice.
In the field, the lack of accurate knowledge about the pipe network limits the effectiveness of sound velocity measurement and multi-point correlation. Both methods only deliver meaningful results if the pipe section on which the measurements are performed is uniform, i.e. the material and/or diameter do not change. However, if the pipe section being measured includes an old repair section, for example, then it is no longer uniform. If the site of this non-uniformity cannot be determined, the calculated leak position has to be confirmed by a different method, ideally by means of an electroacoustic location technique.
Theoretical and practical experiments have shown that relying solely on sound velocity tables in correlation is always associated with considerable potential for error. The question of which is the correct sound velocity for a given pipeline is purely hypothetical. Even a detailed knowledge of the material specification with subsequent calculation of the sound velocity is not sufficient in practice. Simple procedures such as moving the measuring points, measuring the actual sound velocity or even multi-point measurement, however, offer clear improvements in pinpointing accuracy.